Energy Conservation, Work, and Power Problems
Table of Contents
Potential Energy Diagram

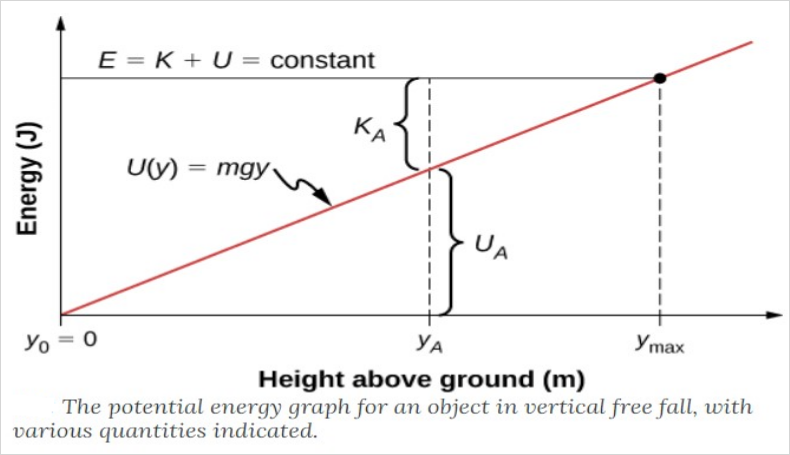
- A potential energy graph is a useful tool in interpreting information as regards the dynamic behavior of potential energy as a function of position.
- This is a linear graph.
- Freely falling object near the surface of the earth is a good example when air resistance is neglected. Mechanical energy is conserved, \(E = K + U\), and the potential energy is zero at ground level.
- \(E_{mechanical}\) is fixed and cannot gain or lose energy because \(W_{non-conservative} = 0\).
Formulas
\begin{align*}
& E = K - U \ge 0 \\
& U \le E \\
& E_{p} = -\int\vec{F}\, d\vec{r} \\
& \vec{F}(x) = -\frac{du}{dx} \\
& E_{k} = E_{mechanical} - E_{p}
\end{align*}
- Expression in terms of y: \(\displaystyle y \le \frac{E}{mg} = y_{max}\)
- The kinetic energy is maximum when the potential energy is minimum and vice versa.
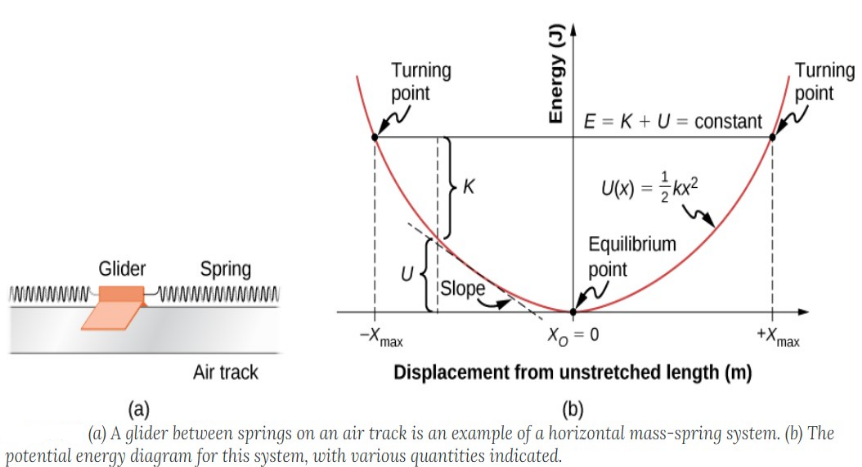
On Spring

- This is using the formula from Spring Potential Energy \(\displaystyle\frac{kx^2}{2}\).
- As you can see, this is a parabola.
- When \(X_0 = 0\), the potential energy is 0 but the kinetic energy is at max.
Types of Equilibrium Points

Stable
- The minimum of the potential energy graph.
Unstable
- The maximum of the potential energy graph.
Neutral
- Neither maximum nor minimum.